Just the facts, ma’am

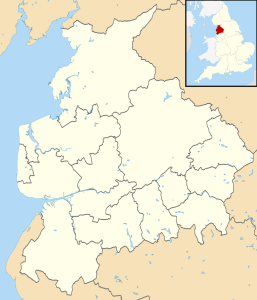
I was in the middle of nowhere earlier today, Lancashire to be precise. When I eventually got a data signal on my phone, I was surprised to see that on Google Maps, the place I was staying also had my reservation dates next to it. “What the hell”, I was thinking. Not that I was up to anything (I was with my wife, so I have witnesses and an alibi), but I didn’t realise my data was being shared. It was then I remembered some of the things we’ve been covering in the DITA lectures and Lab sessions, from information retrieval to APIs and leading up to a brief introduction to technologies that would help enable a semantic web.

Lancashire_UK_district_map_(blank).svg

I was trying to think of an appropriate title for this week’s blog post and whilst watching a short video by Rob Gonzalez about the semantic web being “links between facts” (see video), the thought of the often repeated phrase came to my head. Once again, we have a phrase that is actually a misquote as it was never actually said throughout the original television series of Dragnet, but I’ll come back to that a little later.

Gonzalez went on to say, using diagrams from Tim Berners-Lee, that if we think of Web 1.0 being about documents (that is to say, the use of hyperlinks to connect documents). Web 2.0 is applications, from Twitter to Gmail “and they go beyond just the data that you’re storing on the computers” (again, from the same video). And because the information is not shared with each different company, the data is not connected with each other, so in some cases, if you have a change in your details, you could end up having to go on each account and updating the same information. Web 3.0, in Gonzalez’s words, is about “connecting data at a lower level”, so that “specific data elements can be referenced between documents”.

I was originally hoping to show a cartoon from The Far Side for this post, but after reading an online note from its creator Gary Larson about his concerns, I decided not to use the image and I hope my description will suffice in this case:

A man (looking as if though he’s not the brightest guy on the block) stands in his yard holding a giant paint brush. All around him are painted labels “Shirt”, “Pants”, “The House”, “The Dog”, etc. The cartoon ends with the caption “Now! … That should clear up a few things around here!”

The cartoon was reproduced on a Cambridge Semantics webpage and it made me laugh not because it was the first time I saw it, but it resonated with the feelings I had when I first started looking into the ideas behind semantic web technologies, namely, the idea of tagging everything in XML. I read with interest that there are people trying out Natural-Language Processing technologies, that would attempt to extract the facts that are mentioned within a text (see Semantic Web vs. Semantic Technologies by Feigenbaum), but the difficulties faced mirrored some of the issues found exporting text to be analysed through the word cloud comparisons a few weeks back. Where the difference in punctuation in non-European languages meant that a program not designed to read it was unable to make an accurate word count.

Coming back to thoughts about copyright issues with The Far Side, I wondered whether that could be an issue with a web that links between facts. The World Wide Web Consortium website had a FAQ section that gave an answer that wasn’t quite an answer regarding data cached as a result of an integration process. It basically said that as a semantic web wouldn’t be that different fundamentally to the web we have now, the problems we have now would be more or less the same problems faced with 3.0.

I’ll finish this brief post on the semantic web going back to thought about facts. When is a fact not a fact, or when is a non-fact a fact? Now, if the original television series never said the words that everyone is now misquoting (so much so that it has become a common cultural reference), it becomes a fact because people are applying the social codes within the system of viewer/broadcaster relationship (regardless of whether they have misheard, overheard or heard it in passing like me, having never watched an episode of Dragnet in my life). I have a feeling people might be switching off by now, so I’ll end by saying that I’ve had a lot of fun writing these posts and this is by no means the last thinking on the blog.
The Trials of Oscar Wilde

Law, I have to say, is not my strong point and neither is British history before the 20th Century. So after a few initial searches on the Old Bailey online search page, I turned my attentions to finding something I vaguely heard about: the trials of Oscar Wilde at the Old Bailey.

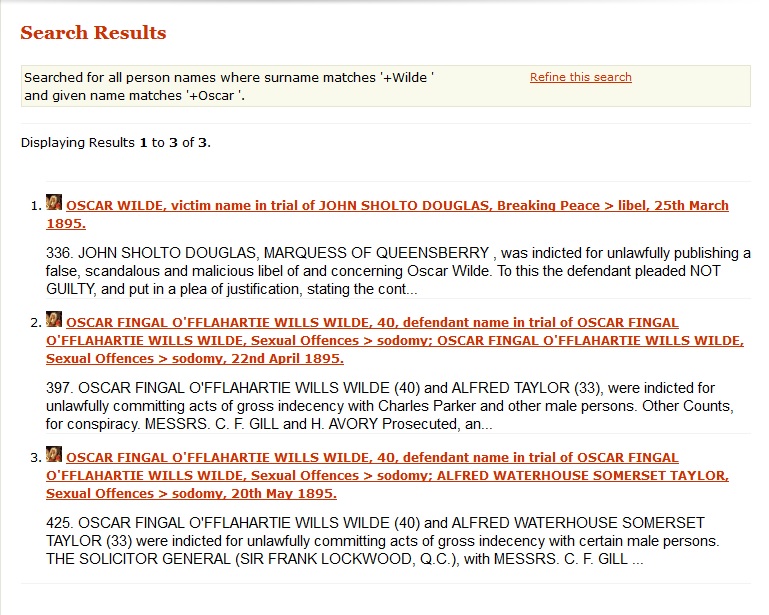
Normal search under name

As the trials are well documented, I wasn’t really looking for any surprises here; full transcripts of the trials are readily available online (see here). The picture above shows the results from the Old Bailey online search, which is very easy to use. Searching through the API demonstrator is quite a different experience. For a start, the layout appears to be more simplified; gone are the ‘Names’ and ‘Alias’ fields of the online search page. The time periods are more precise, as if it was designed for someone with a more purposeful enquiry. It was only after selecting the correct date range, was I able to narrow the results down to the three that I was interested in, which were listed by the reference numbers as their links. The original page images are also not available.

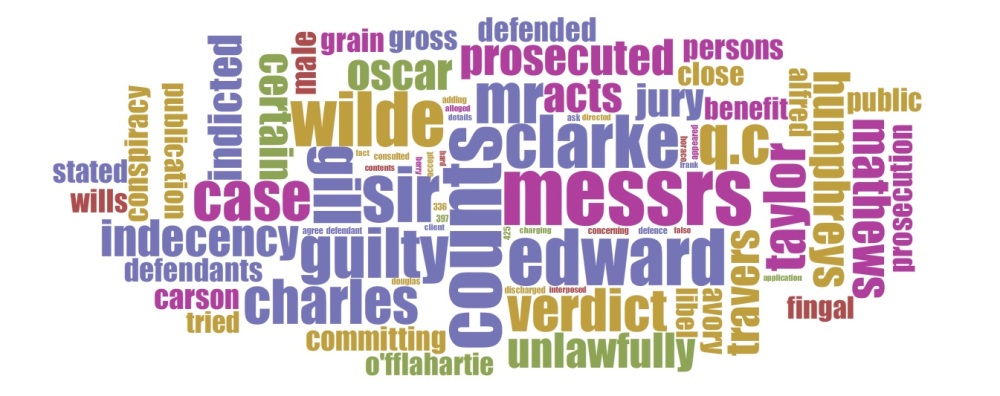
The point of the API demonstrator, of course, is to enable both an exploration and easy export of the data as oppose to simple online viewing of the originals. The site offers a variety of options including a direct link to Voyant Tools, which is the source of the following word cloud.

Wilde Cloud

The API Demonstrator also allows the export of trial texts and trial URLs directly to Zotero, the bibliographical management system. As with any form of text analysis, a better picture of the subject analysed goes a long way in forming any opinions on the results. And indeed, a quick internet search on all the parties involved gave me a better understanding of the different names appearing in the cloud.

If we now take a look at the Translantis project of the Utrecht Text Mining Project. Here, we have a program that uses text mining to look into the role the United States had as a reference culture in everyday Dutch discourse from the beginnings of the 1890s (around about the time of the trials in England) to the late 20th century.

Using the far greater digital data collection of historical newspapers as a source of the research, the project has a greater volume of data to deal with. The reliance on digitalized historic newspapers has the advantage of viewing text that had a direct impact on the everyday lives of the people, but at the same time, it is disadvantaged by the possibility of gaps appearing in the collections due to both the conditions of the original documents and the fact that we are dealing with a greater number of different publishers.

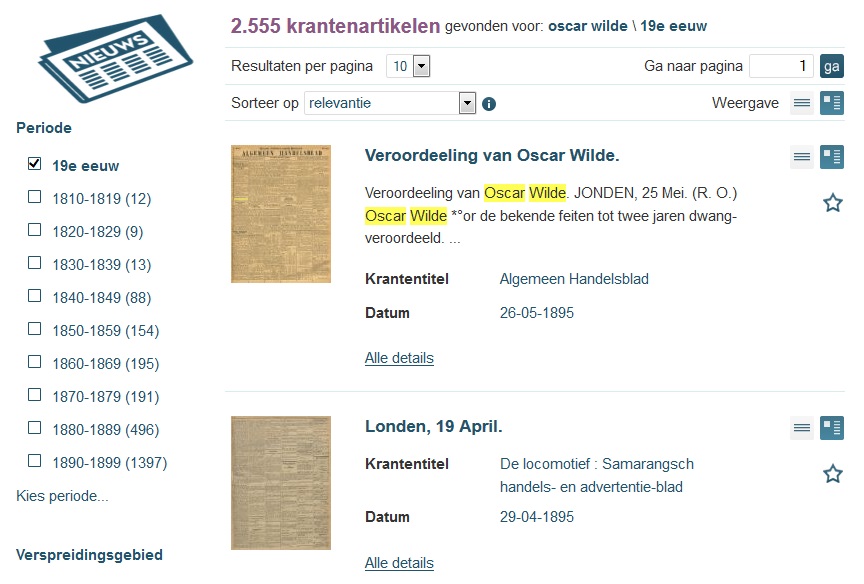
As the text mining tool used by the project, Textcavator, is not available for general play around, I decided to try using the Delpher online search of the National Library of the Netherlands to see the range of information available to the Translantis project.

Delpher newspaper

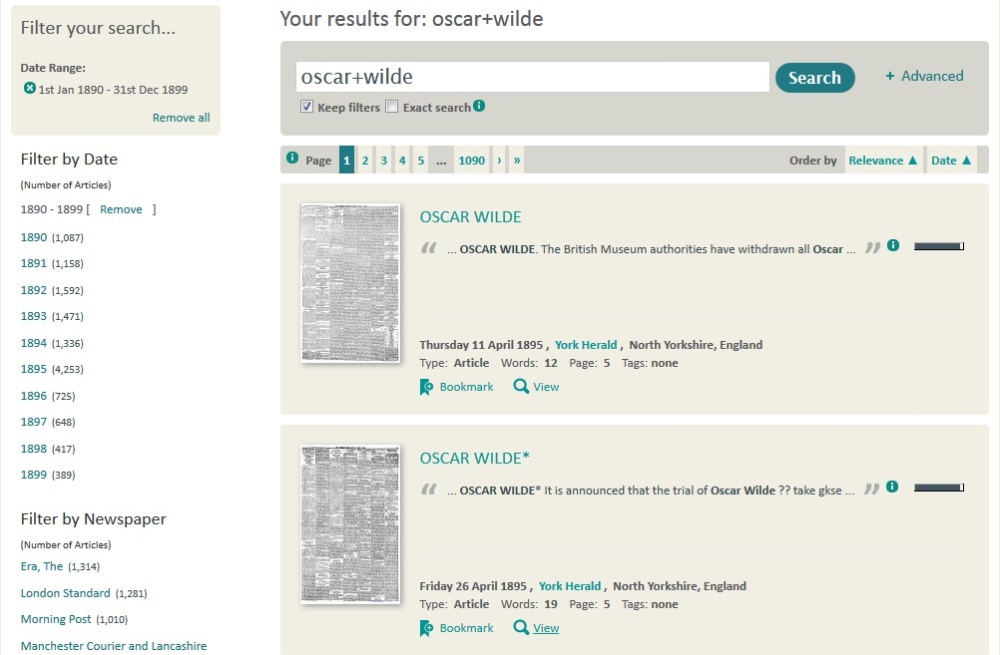
Interestingly, within the sources available at the Dutch library, we see a dramatic rise in articles mentioning Wilde during the period of the trials. If we compare that to the British Newspaper Archives below (which, unfortunately does not allow free access without payment), we see a similar rise followed by a huge drop in the last years of his life.

BNA

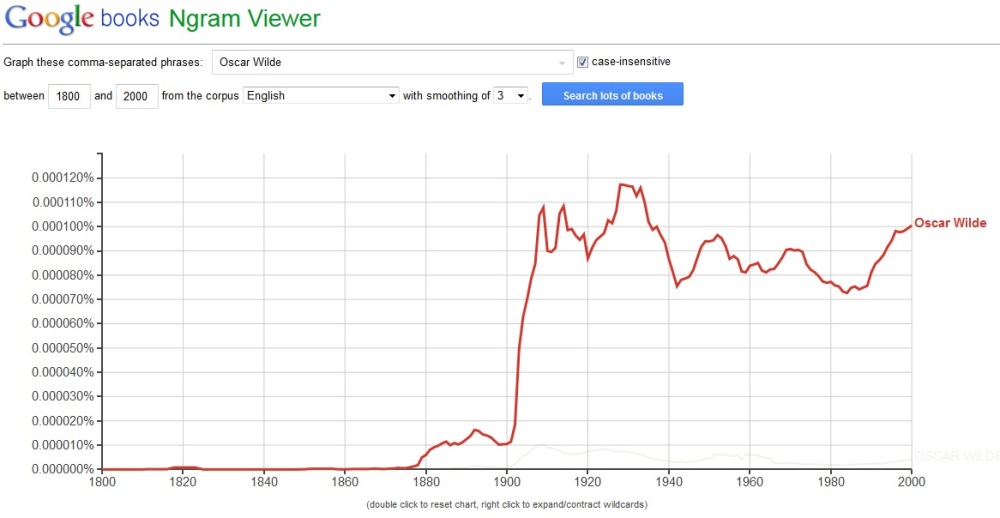
Google books Ngrams Viewer (which I do understand is not newspapers but books digitalized by Google) gives us an idea of the type of results we could see from the text mining that Translantis is conducting. Here, we see an interesting contrast, showing that with books (and that would mainly be the works of Wilde), we see a drop from around the time of the trials that only recovers after his death in 1900.

Ngrams

Perhaps a more interesting enquiry through text mining would be the impact the trials had on the everyday lives of people living in the 20th century. But for now, I’ll leave that to the specialists of digital humanities. What we do see here is the potential of text mining in research and the way in which, in the right hands, one could discover patterns and trends that are hidden, through the overwhelming amount of data sourced, from normal close reading. What I seem to see, however, is that an understanding of the patterns requires both knowledge and reading. So text mining is not a direct opposite of close reading. Far from it, the results possible are very different things indeed.


The Imitation Game

This week, we have a little comparison game, looking into different text analysers and finding their usability, visualisation and actual results. As if you don’t already know, the three contenders are Wordle, Voyant Tools and ManyEyes. I decided to use data from Martin Hawksey’s Twitter Archive Google Spreadsheet (TAGS) here as the result I found from Altmetrics (using the topics that I was interested in) was rather limiting.

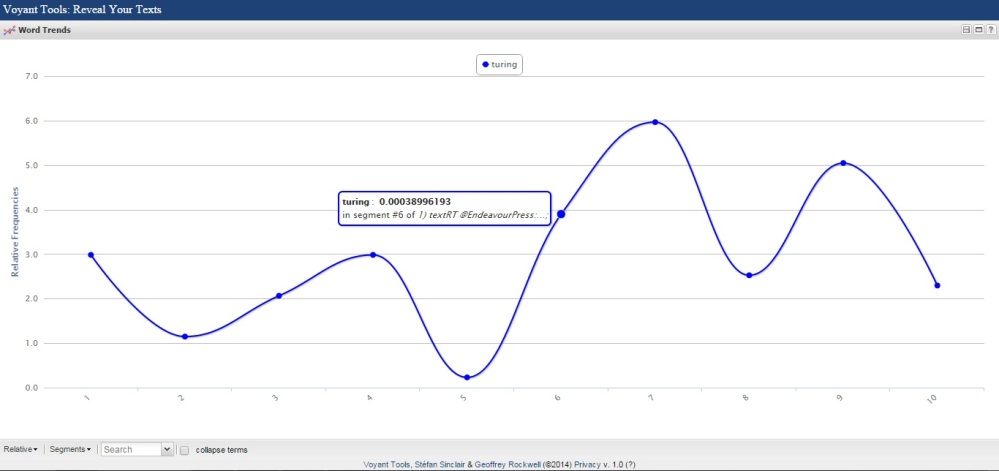
Out of all the highs and lows of the week, I chose to look into the effects a film adaptations might have in the greater subject area that they merely touch upon and what better film to look at than Benedict Cumberbatch’s portrayal of Alan Turing. Concentrating mainly on his contribution at Bletchley Park, what I was interested in seeing was how mentions of Turing on twitter has been affected by the opening of the film.

Wordle

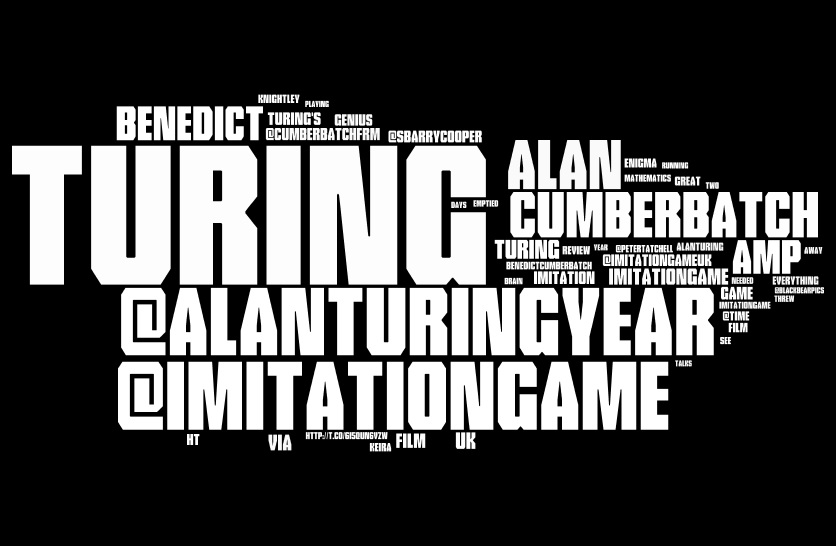
First up is Wordle, chosen because it was the most simple to use. A thing that irritates is the fact that the arrangement of the word cloud changes every time you make changes to the settings, which makes it a bit difficult to make a genuine comparison. The standard colours of the visualisation appears to be rather earthy, though you do have the options of picking your own colours. Right click for word removal is very convenient but overall, I found Wordle to be a little too basic for anything more than simple visualisation. Indeed, with all its visualisation options, including a wide range of fonts and colour, that appears to be its primary function. It doesn’t appear to support certain symbols or East Asian languages, but we’ll say a bit more about that later.

Many pie

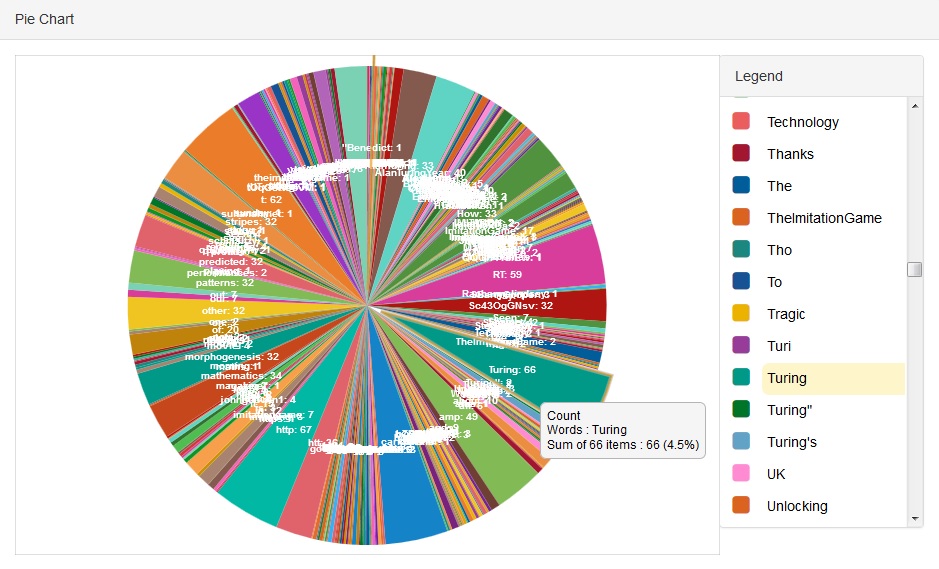
After failing to get ManyEyes to work during the DITA Lab session, I finally got it to do something by simplifying the input data back home. So instead of looking into the entire week, I fed the tweets from one day only. ManyEyes gives you the option of several data visualizations including a pie chart, where you can highlight certain words.

Many cloud

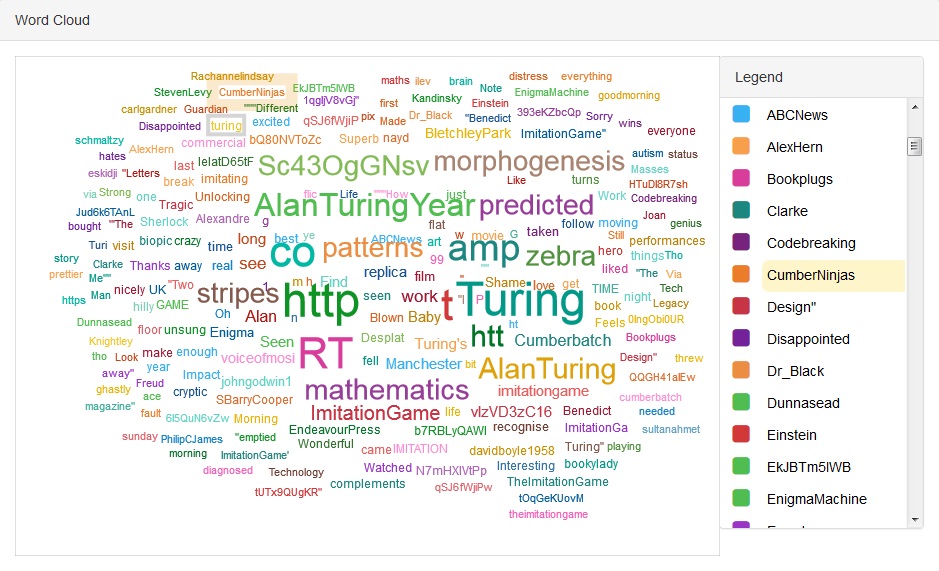
One of the things I should point out was that my first attempt at making a word cloud resulted in a representation of one tweet only. It was only after changing the input from spreadsheet to free text that it recognised the data properly, but using the full data froze the webpage. ManyEyes was able to creat a word cloud with Chinese characters, but as with Voyant Tools, it cannot differentiate where one word ends and another begins, so the cloud consisted of short lines. I wished I had the picture to show you, but after missing the chance to save the visualisation, I lost patience with trying to get it to do it all over again.

Voyant

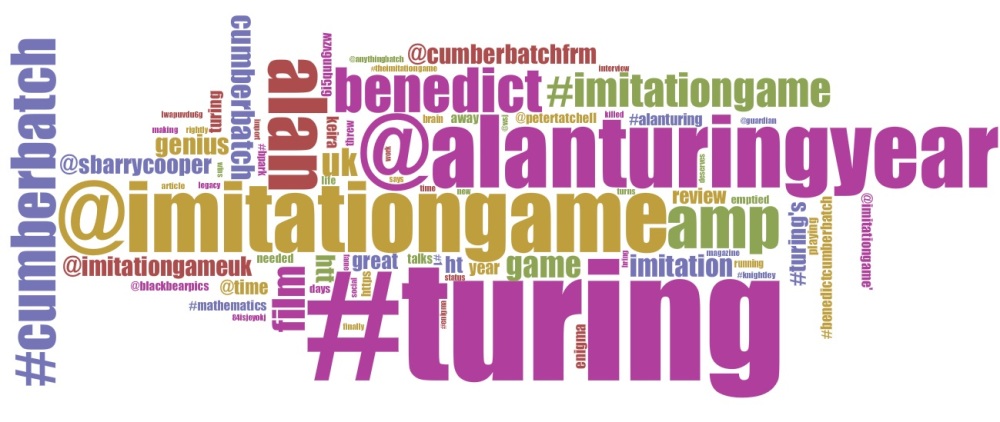
So finally, we have Voyant Tools. Perhaps the most useful in terms of actually analysing the text as most people seem to agree. I love the fact that it lets you scan through the text using the corpus reader which lets you select particular words represented through a graph. Floating the cursor over the word cloud gives you the frequency of its usage.

Voyant 2

You can input all sorts of text into Voyant Tools but the word cloud can only display alphbetical letters, numbers and basic symbols. Likewise, the corpus reader and summary displays Chinese characters but it fails to analysis a full Chinese text correctly as it cannot differentiate words from the sentence.

Out of the three, we can see that the word clouds from Wordle and Voyant Tools shows a certain similarly in its results. Due to the difficulty in using ManyEyes, a true comparison cannot be made here, but we can clearly see that mentions of the film and the actor Cumberbatch himself appears almost as frequently as words associated with Turing.

Don’t read your reviews, weigh them

“Don’t read your reviews, weigh them” (Andy Warhol)

The title of this post is an advice that is often attributed to Andy Warhol, but as with anything coming out of The Factory, it is, at the very best, a mere guess as to what the exact words were, if it was ever said at all. Victor Bockrisbiography of Warhol, made a mention of the quote in relation to Nick Rhodes of Duran Duran (see Bockris, 2003: 175), but as we’re not really here to talk about the New York art scene or Eighties music for that matter, I’ll move on to the more serious subject of altmetrics.

Altmetrics art

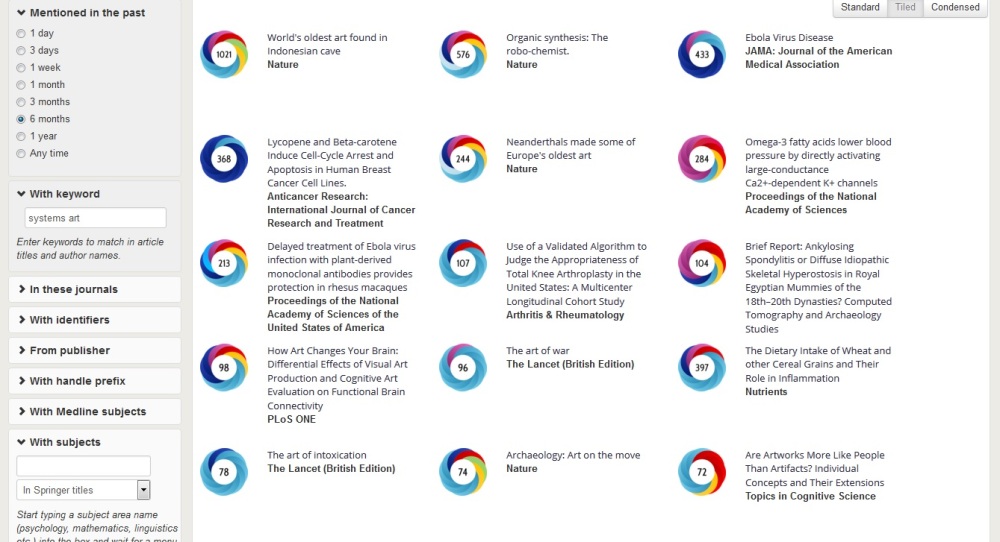
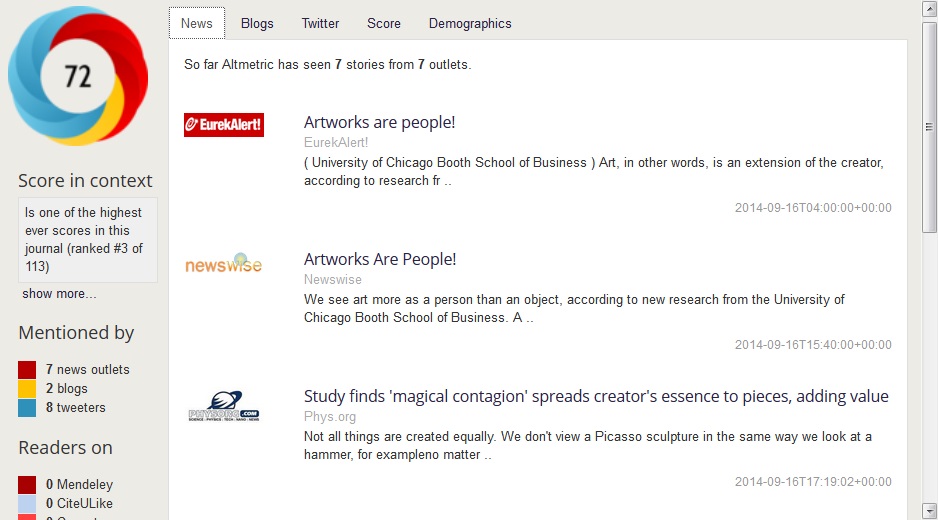
I was very interested in seeing what articles on the Arts I would find on the Altmetrics Explorer and the initial results were quite disappointing. My first reaction was to look around the page I was using and seeing what possible barriers I could find. A couple of things caught my eye, like the Medline subjects and PubMed queries in the filters. Few, with the exception of art therapy, I’d imagine, could possibly be found there. Looking behind the donut shaped visualisation, I discovered other tell tale signs like the use of Connotea reference management as one of the referencing colours. Pinterest, which could be down to visual copyrights. But the one I really wanted to look into, was the one labelled ‘news outlet(s)’.

A newsworthy article

A newsworthy article

Altmetrics provides a very detailed page listing the logos of all of its news sources (see here). Now, I’m not saying that the arts are not newsworthy, but seldom do I see news articles on the arts containing proper references to art history or theory papers. At the very best, they would mention what someone could be researching (which is usually the person writing the article doing a bit of self-promoting). It’s a bit disappointing at times, but as the general public are fed with the view of the arts as mere entertainment or commodity, the newsworthy is usually the sensational or something that reaches record auction prices.

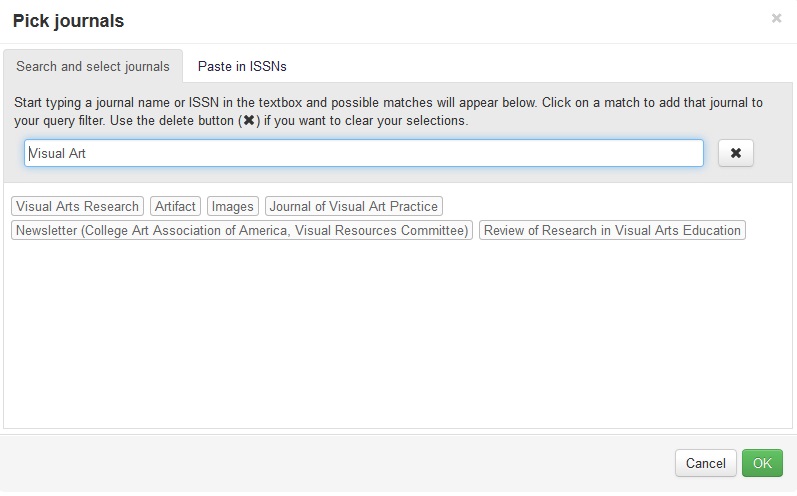
So how about the journals reviewed? Well, the usual suspects of the Oxford Art Journal, Leonardo and the likes came up straight away. As I was surprised that none of the researchers I typed in came up with any results, I decided to search for their journals. Lo and behold, even some of the more obscure journals I could think of came up in the filters, but in searching through them, hardly any articles came up. A few exceptions appeared where the writer tweeted about their own article. Now, I know these papers are talked about, so the problem is not the lack of readership in the particular subjects. The source of Altmetrics comes mainly from free online attentions, so it is perhaps from there that we see an issue.

Altmetrics Pick Journals

Citation is certainly an important part gauging the impact of an article, author or institution, but the importance of an article or author is something entirely different. I remember Professor Zijlmans, one of the speakers in the Systems Art symposium, joked that no one reads published articles if they’re not written in English. The same could be true if we’re not speaking of something that everyone else is talking about.

Darwin famously sat on his papers for quite some time before publishing them and I’m sure the same could be said about a number of important scientific papers in history. Some of the most interesting research comes about from the neglected and forgotten sources, and so although alternative metrics are useful in forming certain decisions, we must be aware that it is not the only way of measuring relevance.

Works cited:

Bockris, V. (2003). Warhol: The Biography. Cambridge, Mass.: Da Capo Press.


Underpants gnomes

The one thing that I found as reading week draws to a close is this: As I try to read more articles, I end up with a bigger list of articles from the number of references I need to look into. So rather than bringing it all to a comfortable level, the list of things I still have to read grows exponentially.

I was watching The Internet’s Own Boy on archive.org (the non-profit digital library) last week, as I couldn’t make it to the #citylis Film Club. Amongst the things that came to mind, around about the bit when they were talking about his involvement with Reddit, was an episode of South Park called “Gnomes.”


According to the Wikipedia entry, the gnomes’ profit plan has been used as a metaphor for everything from under-developed political agendas to the early days of internet businesses. Not that Swartz’s early efforts were in any way failures. Far from it, but the Underpants Gnomes’ three phase plan was probably at the back of my mind as I was working my way through the TAGS (Twitter Archiving Google Sheet) exercise the week before and trying to make sense of what I was doing at the time. In fact, it probably went something like this:

Phase 1: Access Twitter
Phase 2: ?
Phase 3: Data Visualisation!

I found myself with a little more time throughout the week and I started exploring Martin Hawksey’s TAGS site. Playing around with different twitter search results and seeing the results visualised via the TAGSExplorer. As with any form of data analysis, understanding what defines the input data is just as important as the results on show. And this is something we see everyday with the host of statistics and data visualisation in the news and used in advertisements. As long as the audience don’t question the data on show, a pretty visual display would always impress.

Twitter archiving is useful, that I can see, but to use it, we have to appreciate that what we are seeing from the archived tweets is the result of communications purely from Twitter users. So although Twitter itself is a major form of global communication, we are only seeing a fraction of world connections. That is to say, we are seeing only those who tweet and when they do tweet. As for the billions who don’t use Twitter and the millions without access to any form of a computer, we won’t even hear a peep. As long as we appreciate that and use the data accordingly, exploring twitter archives is a valuable way of looking into another form of human document.

The Girl Chewing Gum

Well, what’s been happening this week? After Monday’s DITA lecture, I’ve been trying to get Dub Be Good To Me out of my head without much success. Perhaps it’s the Guns of Brixton bassline, or the harmonica from Sergio Leone’s Once Upon a Time in the West, or maybe I’m just getting on a bit.

There’s been a lot of very good posts about Application Programming Interface this week so I’m going to concentrate more on my experiences embedding into WordPress using shortcodes.

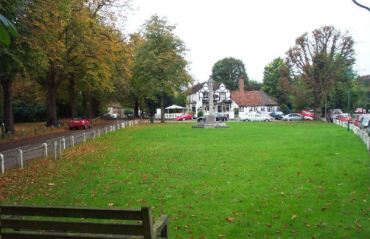
Letchmore_Heath_-_The_Green

Right now, you’re probably thinking why you’re seeing a picture of an English village green. This is Letchmore Heath, or rather, an image of the village taken from Wikimedia Commons. I don’t live there, obviously, it’s a beautiful village near Elstree Studios. It’s also one of the locations of a short film that a couple of us revisited over thirty years after it was made. Anyway, the point is, I’ll be using the data from one of the scenes for this little embedding exercise (not that it’s of any real importance, but the name of the original film is the title of this post).

Embedding from Youtube and GoogleMaps is quite different, with the GoogleMaps requiring the code to be pasted in html mode. Rather than aiming for accuracy, I thought it would be interesting to follow the descriptions and imagery provided by the film itself. So what you’re seeing on the map is the result of a survey matching Google Earth imagery with the information gathered through the film, however inaccurate that may be.

For the videos, I decided to adjust the level of information available to the reader, which was pretty straight forward as the WordPress Support page listed a range of simple codes to make adjustments. Changing the size and the timing of the videos was simply a matter of typing extra code in html.

I realize not everyone would be viewing the post via a computer monitor but I wanted to arrange the videos of the original and its interpretation side by side. That way, the reader could play the videos simultaneously for comparisons. A quick search on Google got me the codes needed to display the videos as I wanted them and a little tweaking with the values meant that I could customize it to my post.

What I’m beginning to see is that html is actually quite straight forward. Getting to know all the tags and shortcodes might have seemed daunting at first but there are plenty of support available online. I do realize, of course, that there’s also the whole world of XML and JSON to make sense of.

One little observation: I did want to get this post out on a weekday, but some of the data I needed for was unavailable due to site maintenance that runs throughout the night (the time that I prefer to work!). That’s not the first time where I found that site maintenance on different platforms meant that I had to postpone certain tasks. The same thing goes with the series of different roadworks that I’m encountering on my daily commutes and that got me thinking: With everything slowly being connected to the internet, might life in the future be defined by the sequence of when different servers are down due to the maintenance. A rather gloomy thought perhaps and one that I hope will not be true.

The Answer to the Ultimate Question of Life, The Universe, and Everything

“In Maturana’s world, my car always works. It is I as an observer who decides that my car is not working because it will not start” (Hayles, 1995).

Working my way through the information retrieval exercises this week got me thinking about the human factor of it all: The fact that we are dealing with people’s relationship with documents and information. And I suppose it really comes to light when the results from a natural language query comes up with a load of things you didn’t want to know in the first place. In your head, the voice of a TV character from Little Britain goes “Computer says no”.

Hayles comment on Maturana‘s idea of a self-maintaining system makes a very simple yet relevant point (and here, I’m not going to go into a deep discussion into the concept of autopoiesis or perhaps even Luhmann’s take on autopoiesis through his social systems theory): The car as a system is behaving as it should, in accordance to its simple organisation. It knows nothing of your intentions to use it to drive into the traffic jam down the road. The shortage of fuel in the tank means that, in short, the pistons will remain stationary and so would the car itself. It is the driver, as an observer of the system applying their view of cause and effect, who ‘sees’ the car as not working.

Going back to the point of information retreival, as far as the search engine is concerned, it has completed its part of the deal. The observer entered a search request and through its algorithms, a whole list of results is displayed. Perhaps the observer never realised what the actual question they entered was. You are, after all, dealing not with a fellow human being who at the very least, might try to find a common ground. But if everyone simply accepts what we are given from the limits of a given system, the world would still continue to go around, albeit in a rather unusual, if not hilarious fashion (see Translate Server Error).

I guess ultimately, we want a system of information retrieval where the two sides share enough knowledge to adapt to our needs. We are seeing search engines that ‘learn’ our preferences, but here is the problem: A system that learns to please us would, in time, give us a far more limiting view of the world as we end up observing the world purely as an observation of another within ourselves. Thus, completing the self-contained and operationally closed autopoietic system. As a researcher, student, library user or possibly someone who want to know more about the world, the only way to truely gather information is to make a more structured enquiry. The Boolean retrieval model is not perfect in itself but it does provide a greater control of the search criteria. The beauty of natural language query is that, rather like walking up to a set of shelves in a library and simply browsing, there’s a chance of finding something that you never thought of looking for. So perhaps we have a better chance of finding the ultimate answer to life, the universe, and everything, for ourselves, simply by adopting a variety of enquiries. The answer may not be the one you’d expect, but accept the fact that it is the query itself that needs questioning.

First post

Well, this is my very first attempt at writing a blog so bear with me if this gets a bit boring. There’s certainly a lot of ideas to take in but it is making some kind of sense so far.

Something that was of interest to me the other day was the mentioning of cultural bias in the langauge of technology. As I was playing around switching from html to visual editing, I couldn’t help but think that everything was in English. Now you could say that I did choose English as my prefered language when I started the blog but with everything set within the “pre-defined presentation semantics“, I thought back at the very first quote that came up on the board at the beginning of the DITA lecture, the quote from Buckminster-Fuller regarding change and how it should be implemented. What would happen if the basic language of the webpage was set-up using the structures of a non-Latin language?

George Lakoff opens the book ‘Women, Fire, and Dangerous Things’ with a very interesting intro into the noun class systems of the Dyirbal language and apart from those of us who change between languages on a regular basis, we rarely think about the impact of the limitations of categories until we have to communicate something within another set of rules. We do, of course, already have web addresses in non-Latin languages which started around 4 years ago and it’s interesting to see that the conference for this historic decision was held in South Korea, a country that has its own alphabet and keyboard system which they are very proud of (and happens to be very easy to use). Would having a variety of markup languages make the development of the internet more accessible to more people or would it generate a more audience specific internet use?

Well, after doing a little bit of research through a popular search engine, I found that you could actually make non-Latin tags by using Extensible Markup Language, although as one person pointed out in a forum asking a similar question, markup language is “(n)ever in English. HTML is always in HTML.” @@ Time for me to hit the books to gather more information, I think.